Table of Contents
Showing any transport system simulation makes many things easier. For example, if one can see live Light-Rail system simulation on one's PC, one can know position of any light-rail at any point of time and determine when it will be at a particular place. Depending on this, one can make plans for commuting.
Light-Rail Simulation can also be used for showing current location of the light-rail one is riding on the map to keep the passengers aware of their current locations and how they are going to commute exactly. If this feature can be implemented within a screen of the light-rail, it will be very convenient for the passengers. They can observe the connections available to them from the intermediate station. It is always good to know where exactly one is and how long it will take one to reach one's destination.
Here, the case of VTA (Valley Transport Authority) Light-Rail of San Jose in California is taken for sample implementation. This can be replicated for any other public transport system with some modifications. For example, this can be implemented for the Bus-service of VTA.
There are many public transport simulations done for traffic conditions analysis and detection of possible traffic congestion. While, almost none of them are designed for passengers, this one is specially designed for the travelers of the light-rail. It will be helpful for them to decide which light-rail to use at what time. In that way, it is different from the other jobs done in simulation of public transport.
The Light-Rail Schedules, required to show light-rail simulation using svg, are obtained from the web site, where it is broadcasted in html format. A php code is written to retrieve the tabular data from html and convert that into the desired xml format. The html page is retrieved using curl functions of php and traversed for required data using xpath expressions. Finally, the retrieved data is formatted into arrays and transformed into an xml file. All of the schedule pages are created in similar way with similar format, so once the code becomes ready for one page, it also works for all other schedule pages.
The schedule data is most of the time static. It changes once in a year at that time we can re-run the php program to re-build the xml files according to new schedules. There will not be any need to change the program because it will be independent of the data and will be dependent of the xml data format specified by the DTD.
DTD for the xml data storage is given below:
<?xml version = "1.0" encoding ="utf-8" ?>

<!ELEMENT routes (route*) >
<!ELEMENT route (routeName, routeNumber, day, direction*) >
<!ELEMENT routeName (#PCDATA) >
<!ELEMENT routeNumber (#PCDATA) >
<!ELEMENT day (#PCDATA) >
<!ELEMENT direction (directionName, trip*) >
<!ELEMENT directionName (#PCDATA) >
<!ELEMENT trip (tripNumber, stations*) >
<!ELEMENT stations (station*) >
<!ELEMENT station (stationNumber, stationName, time) >
<!ELEMENT tripNumber (#PCDATA) >
<!ELEMENT stationNumber (#PCDATA) >
<!ELEMENT stationName (#PCDATA) >
<!ELEMENT time (#PCDATA) >
JQuery SVG Plugin is used for adding interactivity to svg. Using JQuery for svg animation is efficient when one is comfortable with javascript programming. I created a function named animateDot where I am passing values array to my user-defined animation function, which in-turns manages the animation of the dot representing the light-rail by applying JQuery animation inside the user-defined animateDot function. The xml data generated by php code is being used here to show names of all the stations on the route map and run the simulation according to schedule specified in the xml data files.
The code fragment below is drawing the map, placing stations on that map and setting up the animation path as per the values found in values array, which is prepared from the xml data available from the site.
var stations = svg.group({fill:'white', stroke:'grey', strokeWidth:1});
var tPath = svg.createPath();
var txts = svg.createText();
var txt = svg.text("",{fontSize:10});
for(var i=0;i<values.length;i++)
{
	svg.circle(stations, values[i][0], values[i][1], 7,
        {onmouseover:"$(this).animate({svgFill:'yellow'});",
         onmouseout:"$(this).animate({svgFill:'white'});"});
	tPath.reset();
	txts.reset();
	txt = svg.text("",{fontSize:10, id:'stationName'+i});
	if(i<=5)
		svg.path(tPath.move(values[i][0],values[i][1]-7).line(values[i][0]+130,
                 values[i][1]-140),{fill:'none', stroke:'none', id:'tPath'+i});
	else
		svg.path(tPath.move(values[i][0]+15,values[i][1]+5).line(values[i][0]+150,
                 values[i][1]+5),{fill:'none', stroke:'none', id:'tPath'+i});
	svg.textpath(txt, '#tPath'+i, txts.string(values[i][3]));
}

var dot = svg.group({fill:'red', stroke:'black', strokeWidth:1});
var movingDot = svg.circle(dot, values[0][0], values[0][1], 4,
    {onclick:"animateDot($(this))", opacity:0.7, id:'dot'});
the animateDot method required by the above code fragment is given below:
function animateDot(svg)
{
for(var i=1;i<values.length;i++)//forward motion
{
svg.animate({svgCx:values[i][0],svgCy:values[i][1]},values[i][2]);
}
for(var j=values.length-2;j>=0;j--)//reverse motion
{
svg.animate({svgCx:values[j][0],svgCy:values[j][1]},values[j+1][2]);
}
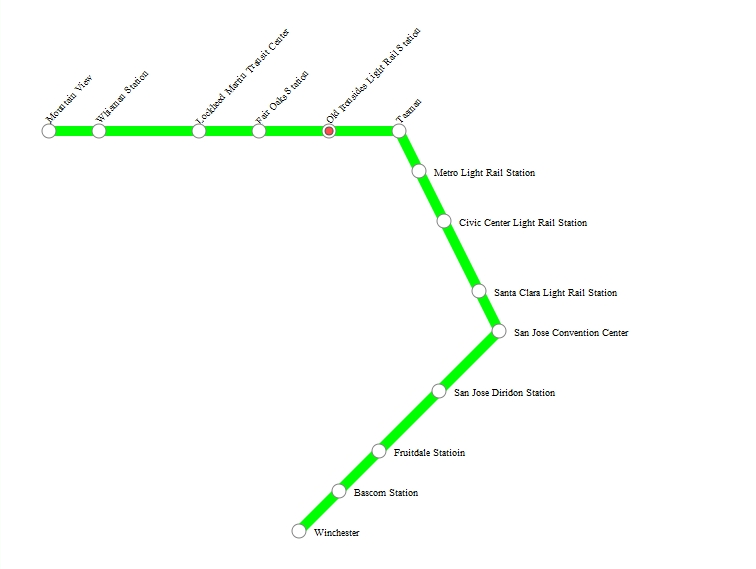
}The code fragment shown above is used to animate the dot representing a light-rail among the path created. The first loop moves the dot into a forward direction, while the second loop moves into a reverse direction once it reaches the terminal. The code segment below shows a sample of array values:
var values = new Array(new Array(50,150,0,'Mountain View'),
new Array(100,150,4000,'Whisman Station'),
new Array(200,150,8000,'Lockheed Martin Transit Center'),
new Array(260,150,6000,'Fair Oaks Station'),
new Array(330,150,5000,'Old Ironsides Light Rail Station'),
new Array(400,150,7000,'Tasman'),
new Array(420,190,10000,'Metro Light Rail Station'),
new Array(445,240,5000,'Civic Center Light Rail Station'),
new Array(480,310,7000,'Santa Clara Light Rail Station'),
new Array(500,350,4000,'San Jose Convention Center'),
new Array(440,410,6000,'San Jose Diridon Station'),
new Array(380,470,4000,'Fruitdale Statioin'),
new Array(340,510,2000,'Bascom Station'),
new Array(300,550,5000,'Winchester'));
This array values is of the format Array(Array(x,y,time,stationName), Array(x,y,time,stationName), ...). Here, x is x co-ordinate of the station, y is y co-ordinate of the station, time is the amount of time required to reach that station from previous station and stationName is the name of that station. Values is collection of such arrays and thus, collection of station data.
At present VTA has provided a map with all stations and information. But, all information there are static and not related to the light-rail schedules. While, the proposed system will show the simulatioin of light-rails on the map showing their current location on the map. It will be more useful to the light-rail services users by providing a clear idea about how the system works and which connection is available to them.
This research can be used to implement actual light-rail simulation system which may include many more interactive functionalities as per user requirements. For example, it can provide suggested connections based on the destination from current point. Due to limited time constraint, this research has to come to end a bit early. But, future work on this will include more developments to the current state of the research.
Darshan K. is a Computer Science graduate student at San Jose State University, CA, USA. He has received B.E. degree in Computer Engineering from Saurashtra University, Gujarat, India. His areas of interest include Java, PHP, XML, SVG, JavaScript and other technologies related to web programming. He has worked in Tata Consultancy Services, Gandhinagar, India for 4 months as an Intern. He had 1 year of job experience in the field of J2EE programming at DevIndia Infoway, India.
[1] Passenger travel behavior model in railway network simulation. Proceedings of the 38th conference on Winter simulation. Winter Simulation Conference. Monterey California USA . 2006. p. 1380-1387. 1-4244-0501-7. http://doi.acm.org/10.1145/1218112.1218364.
[2] Simone: large scale train network simulations. Proceedings of the 33nd conference on Winter simulation. IEEE Computer Society. Washington DC USA . 2001. p. 1042-1047. 0-7803-7309-X. http://doi.acm.org/10.1145/564124.564274.
[3] SVG for educational simulations. CITC5 '04: Proceedings of the 5th conference on Information technology education. ACM. New York NY USA . 2004. p. 43-49. 1-58113-936-5. http://doi.acm.org/10.1145/1029533.1029545.
[4] Automatic hidden-web table interpretation, conceptualization, and semantic annotation. Elsevier Science Publishers B. V.. Amsterdam The Netherlands The Netherlands . 2009. 7. p. 683-703. 0169-023X. http://dx.doi.org/10.1016/j.datak.2009.02.010.